
By Divya Puramshetty, Program Management Lead , Saamuhika Shakti
Addressing complex, systemic development challenges or “wicked problems”, requires collaboration among multiple expert organizations, each addressing the wicked problem from diverse social, economic, cultural, political and environmental lenses. For such collaboration to be meaningful within the same focus localities, it is critical to ensure that resources are used effectively and efficiently, while guaranteeing that intended groups have equitable access to services without exclusion or duplication. Achieving this balance calls for intelligent yet adaptive monitoring mechanisms that are rooted in a ground-up approach and sensitive to local contextual realities.
Two years into Phase 1 of Saamuhika Shakti, partners came together to reflect on critical questions: Were all primary stakeholders across program localities receiving interventions? Were some families being left out? How many families were accessing more than one type of intervention? And were overlaps reinforcing impact, or simply creating duplication and inefficient use of resources?
These reflections highlighted the need for a cohesive, ground-up monitoring mechanism, one that could build a shared understanding of both the localities and the families that the program aimed to serve. Partners also recognized that such a mechanism could not rely on secondary data alone, but instead needed to be deeply rooted in local context, given the complexities of the vulnerable populations involved. This collective realization led to the launch of the social mapping exercise at the start of Phase 2.
In this knowledge piece, as the backbone, we will elaborate on three key questions:
Social mapping is a planning tool used to create a visual representation of a community or area, outlining households, resources, institutions, and social groups. It helps capture the social and spatial dynamics of a community—who lives where, what resources exist, and how different groups interact with or access those resources.
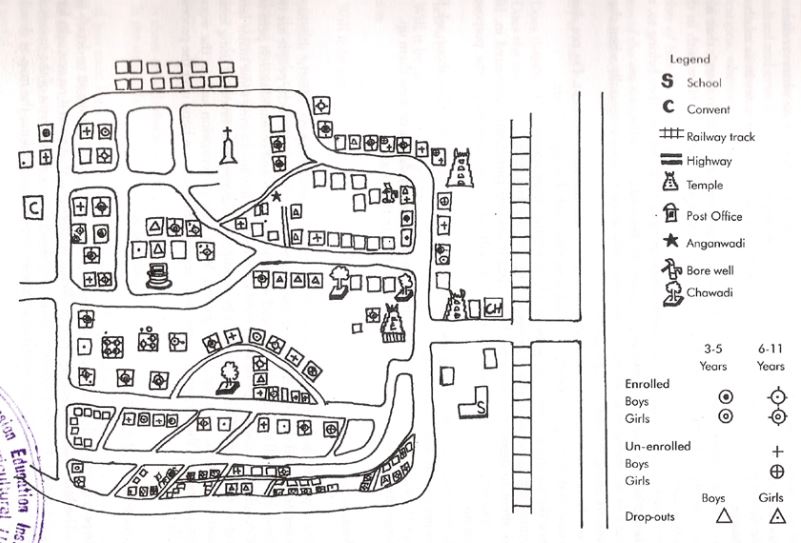
As a Participatory Action Research (PAR) tool, social mapping actively involves community members. By drawing or co-creating maps, community members represent households, resources, and services as they experience them, making local knowledge a legitimate source of data. Social mapping has wide-ranging applications in social research and development because it enables a deeper understanding of communities and their needs, while enabling a deeper sense of ownership in problem articulation and solution design. Some common use cases include:
In this way, social mapping strengthens community participation, enhances transparency, enables efficient resource allocation, and supports evidence-based decision-making.
In Phase 2, social mapping was carried out in waste picker communities to ensure that all program partners developed a shared understanding of the communities served by Saamuhika Shakti, while also fostering deeper collaboration within each community.
The exercise was jointly led by five partner organizations delivering last-mile services, with support from the backbone team, to achieve three core objectives:
The social mapping exercise was driven through a structured, collaborative process. It began with partner consultation workshops to align on objectives and plan execution, followed by the development of a guidelines toolkit to streamline last-mile implementation across locations. To ensure standardized understanding and delivery, multiple training sessions were conducted for field workers, while also allowing flexibility to adapt the process to local contexts. The actual execution was jointly carried out by on-ground partners and data collectors on-boarded by the backbone team. Using a ground-up approach, teams conducted transect walks, observed localities, recorded details, and produced visual maps. Two pilots were conducted collaboratively to build a shared understanding before the full-scale roll-out. Periodic check-ins enabled real-time progress tracking and problem-solving, while parallel digitization efforts enhanced efficiency and consistency.
.png)
The social mapping process followed by Saamuhika Shakti was adapted to meet programmatic needs and incorporated key refinements compared to the conventional PRA exercise. While social maps traditionally capture details on social infrastructure and socio-cultural dynamics, Saamuhika Shakti prioritised estimating the total number of primary stakeholder households. Details on social stratification, such as community relationships, networks, and hierarchies, were intentionally deprioritized and excluded from this exercise.
Consequently, the process featured limited community participation. Unlike conventional mapping, which is a highly participatory process, with communities co-developing maps, reflecting on local dynamics, and identifying service and infrastructure gaps, this exercise was more focused on collecting household-level data. The exercise was led primarily by Community Resource Persons (CRPs) from partner teams, who drew on their established local knowledge and relationships. Community members were engaged mainly in verifying household type and family size.
.png)
This exercise was driven over a period of 6-8 months, and revealed valuable insights:
Time and resource intensity: The social mapping exercise was both time and resource intensive, requiring careful planning and significant investment from the point of design to execution—which together spanned nearly eight months. The project began with a three-month strategising phase where partner teams aligned on objectives and finalised a detailed, iterative execution plan with defined roles. This upfront time was crucial for ensuring the design reflected the realities of waste picker households. Following this, one month was spent developing all necessary systems, tools, and guidelines. The final four months were dedicated to the actual implementation across all localities. Prioritising the initial planning phase guaranteed a smooth and successful execution.
Collaborative planning and execution: Strong collaboration among partner organisations and the backbone team was a key factor in the successful completion of the social mapping exercise. Collaboration ensured alignment, shared ownership, and legitimacy of the process. While the backbone team led on design, guidelines, and overall adaptation, partners shaped the approach through joint workshops and planning sessions. During execution, partner teams spearheaded the fieldwork: project leads coordinated schedules and visits, while CRPs organized logistics, secured community consent, and jointly developed social maps and household data.
Standardised resources and tools: Given the scale and intensity of the exercise, multiple teams had to work in sync. This required standardised tools, consistency, and shared practices. For example: comprehensive guidelines and SOPs, standard templates for household data collection, shared communication channels for real-time troubleshooting and 3 dedicated field coordinators to support CRPs and ensure adherence to processes. Without such resources & practices, the risk of data inconsistencies and fragmented outputs would have been high, undermining the value of the exercise.
Adaptability and agility: Despite the need for standardisation, adapting to local contexts was equally critical. In some dense settlements, social maps could not be developed due to settlement structures, migration patterns, and community dynamics, requiring partners to deprioritize those areas. On-ground logistics also demanded agility. In some localities, mapping could only be done in the afternoons when residents returned from waste picking, while in others mornings worked better. These variations reinforced the importance of flexible planning and close coordination among CRPs, partner teams, and the backbone.
Data safety and ethical use: Since social mapping generated sensitive household-level data, measures were required to maintain confidentiality and ensure ethical use. In Saamuhika Shakti, it was agreed that maps would be accessible only to partner organisations and the backbone team. The data was to be used solely for program-related activities, governance, evaluation, or evidence generation purposes aimed at improving the quality of program delivery. While maps were initially created as hard copies during the field visits, all were digitised to create a secure, long-term repository. This safeguarded confidentiality while making the data easily accessible for ongoing program use.
In Saamuhika Shakti, social mapping was more than a visualisation tool. It became a mechanism for evidence-based measurement of program reach and for informing ongoing intervention planning. Most importantly, the process reinforced the collective action approach, showing that the process of collaborative action is as important as the data itself. As the program evolves, the challenge ahead is to keep these maps dynamic and actionable, ensuring they remain living tools for both partners and the communities they serve.
By Divya Puramshetty, Program Management Lead , Saamuhika Shakti
Addressing complex, systemic development challenges or “wicked problems”, requires collaboration among multiple expert organizations, each addressing the wicked problem from diverse social, economic, cultural, political and environmental lenses. For such collaboration to be meaningful within the same focus localities, it is critical to ensure that resources are used effectively and efficiently, while guaranteeing that intended groups have equitable access to services without exclusion or duplication. Achieving this balance calls for intelligent yet adaptive monitoring mechanisms that are rooted in a ground-up approach and sensitive to local contextual realities.
Two years into Phase 1 of Saamuhika Shakti, partners came together to reflect on critical questions: Were all primary stakeholders across program localities receiving interventions? Were some families being left out? How many families were accessing more than one type of intervention? And were overlaps reinforcing impact, or simply creating duplication and inefficient use of resources?
These reflections highlighted the need for a cohesive, ground-up monitoring mechanism, one that could build a shared understanding of both the localities and the families that the program aimed to serve. Partners also recognized that such a mechanism could not rely on secondary data alone, but instead needed to be deeply rooted in local context, given the complexities of the vulnerable populations involved. This collective realization led to the launch of the social mapping exercise at the start of Phase 2.
In this knowledge piece, as the backbone, we will elaborate on three key questions:
Social mapping is a planning tool used to create a visual representation of a community or area, outlining households, resources, institutions, and social groups. It helps capture the social and spatial dynamics of a community—who lives where, what resources exist, and how different groups interact with or access those resources.
As a Participatory Action Research (PAR) tool, social mapping actively involves community members. By drawing or co-creating maps, community members represent households, resources, and services as they experience them, making local knowledge a legitimate source of data. Social mapping has wide-ranging applications in social research and development because it enables a deeper understanding of communities and their needs, while enabling a deeper sense of ownership in problem articulation and solution design. Some common use cases include:
In this way, social mapping strengthens community participation, enhances transparency, enables efficient resource allocation, and supports evidence-based decision-making.
In Phase 2, social mapping was carried out in waste picker communities to ensure that all program partners developed a shared understanding of the communities served by Saamuhika Shakti, while also fostering deeper collaboration within each community.
The exercise was jointly led by five partner organizations delivering last-mile services, with support from the backbone team, to achieve three core objectives:
The social mapping exercise was driven through a structured, collaborative process. It began with partner consultation workshops to align on objectives and plan execution, followed by the development of a guidelines toolkit to streamline last-mile implementation across locations. To ensure standardized understanding and delivery, multiple training sessions were conducted for field workers, while also allowing flexibility to adapt the process to local contexts. The actual execution was jointly carried out by on-ground partners and data collectors on-boarded by the backbone team. Using a ground-up approach, teams conducted transect walks, observed localities, recorded details, and produced visual maps. Two pilots were conducted collaboratively to build a shared understanding before the full-scale roll-out. Periodic check-ins enabled real-time progress tracking and problem-solving, while parallel digitization efforts enhanced efficiency and consistency.
The social mapping process followed by Saamuhika Shakti was adapted to meet programmatic needs and incorporated key refinements compared to the conventional PRA exercise. While social maps traditionally capture details on social infrastructure and socio-cultural dynamics, Saamuhika Shakti prioritised estimating the total number of primary stakeholder households. Details on social stratification, such as community relationships, networks, and hierarchies, were intentionally deprioritized and excluded from this exercise.
Consequently, the process featured limited community participation. Unlike conventional mapping, which is a highly participatory process, with communities co-developing maps, reflecting on local dynamics, and identifying service and infrastructure gaps, this exercise was more focused on collecting household-level data. The exercise was led primarily by Community Resource Persons (CRPs) from partner teams, who drew on their established local knowledge and relationships. Community members were engaged mainly in verifying household type and family size.
This exercise was driven over a period of 6-8 months, and revealed valuable insights:
Time and resource intensity: The social mapping exercise was both time and resource intensive, requiring careful planning and significant investment from the point of design to execution—which together spanned nearly eight months. The project began with a three-month strategising phase where partner teams aligned on objectives and finalised a detailed, iterative execution plan with defined roles. This upfront time was crucial for ensuring the design reflected the realities of waste picker households. Following this, one month was spent developing all necessary systems, tools, and guidelines. The final four months were dedicated to the actual implementation across all localities. Prioritising the initial planning phase guaranteed a smooth and successful execution.
Collaborative planning and execution: Strong collaboration among partner organisations and the backbone team was a key factor in the successful completion of the social mapping exercise. Collaboration ensured alignment, shared ownership, and legitimacy of the process. While the backbone team led on design, guidelines, and overall adaptation, partners shaped the approach through joint workshops and planning sessions. During execution, partner teams spearheaded the fieldwork: project leads coordinated schedules and visits, while CRPs organized logistics, secured community consent, and jointly developed social maps and household data.
Standardised resources and tools: Given the scale and intensity of the exercise, multiple teams had to work in sync. This required standardised tools, consistency, and shared practices. For example: comprehensive guidelines and SOPs, standard templates for household data collection, shared communication channels for real-time troubleshooting and 3 dedicated field coordinators to support CRPs and ensure adherence to processes. Without such resources & practices, the risk of data inconsistencies and fragmented outputs would have been high, undermining the value of the exercise.
Adaptability and agility: Despite the need for standardisation, adapting to local contexts was equally critical. In some dense settlements, social maps could not be developed due to settlement structures, migration patterns, and community dynamics, requiring partners to deprioritize those areas. On-ground logistics also demanded agility. In some localities, mapping could only be done in the afternoons when residents returned from waste picking, while in others mornings worked better. These variations reinforced the importance of flexible planning and close coordination among CRPs, partner teams, and the backbone.
Data safety and ethical use: Since social mapping generated sensitive household-level data, measures were required to maintain confidentiality and ensure ethical use. In Saamuhika Shakti, it was agreed that maps would be accessible only to partner organisations and the backbone team. The data was to be used solely for program-related activities, governance, evaluation, or evidence generation purposes aimed at improving the quality of program delivery. While maps were initially created as hard copies during the field visits, all were digitised to create a secure, long-term repository. This safeguarded confidentiality while making the data easily accessible for ongoing program use.
In Saamuhika Shakti, social mapping was more than a visualisation tool. It became a mechanism for evidence-based measurement of program reach and for informing ongoing intervention planning. Most importantly, the process reinforced the collective action approach, showing that the process of collaborative action is as important as the data itself. As the program evolves, the challenge ahead is to keep these maps dynamic and actionable, ensuring they remain living tools for both partners and the communities they serve.


